Introduction and Background
"In 2013, over 17.5 million households in the United States did not have consistent access to healthy, safe, and nutritious food" (Lowery et al. 2016, 2). This lack of food access can cause numerous health problems in adults and children such as obesity, diabetes, and hypertension (Lowery et al. 2016). In addition, there is a significant correlation between poverty and lack of access to fresh fruits and vegetables (LeClair and Aksan, 2014). However, the link between a diet high in fruits and vegetables and good health is well-substantiated (Dimitri et al. 2013). The issue then becomes this: how can access to fruits and vegetables be increased? For low-income neighborhoods, farmers’ markets may be the answer.
According to Lowery et al, (2016, 4), “Studies have found that farmers’ markets increase the variety and access to healthy foods in food desert communities, low-income shoppers, and limited-mobility shoppers.” Farmers’ markets are also an alternative way to introduce new food sources in low-income non-white neighborhoods that have difficulties establishing a new food source in the area (Dimitri et al. 2013). In an attempt to navigate the troubles of food insecurity in the Greater Chattanooga area, Hamilton County has established a framework that prioritizes access to healthy and fresh foods for all citizens. Detailed in the 2030 update of the Chattanooga- Hamilton County Comprehensive Plan, “Access to Produce and Fresh Foods” is listed as one of the area’s key issues from prior planning efforts. (Regional Planning Agency 2016).
Historically, the city of Chattanooga has struggled with food deserts and the resulting increase in obesity rates. One way Chattanooga can remedy this is implementing farmers’ markets. Although implementing a farmer’s market will provide fresh fruits and vegetables, it does not mean that the food is accessible to residents, particularly low-income residents such as Supplemental Nutrition Assistance Program (SNAP) participants. Two issues arise: the lack of transportation and ability to use nutrition assistance programs. For many in Chattanooga, limited access to transportation denies them the ability to seek out healthy foods, and perpetuates the issues at hand (Johnson 2015).
To create healthier communities access to fresh, nutritious food is critical, especially for nutrition assistance program participants. Considering that 1 in 7 people in the Chattanooga area struggles with hunger, with hunger being exacerbated in children, at rates of 1 in 4, it is crucial that farmers’ markets are accessible for citizens of Chattanooga (Hunger in America 2018). Furthermore, with 27 percent of Chattanooga residents report not having a place to purchase fresh produce within one mile of their homes it is clear that accessibility is the largest barrier to addressing Chattanooga’s fresh food crisis (Urban League of Greater Chattanooga 2012). Based on this information, we sought to understand the accessibility of SNAP participants to farmers’ markets that accepted SNAP using public transportation.

Methods
The goals of this study were twofold: one to interview local farmer's markets and two, to perform a spatial analysis of the accessibility of SNAP participants to said markets using public transportation. The geospatial portion of this study was comprised of two major analyses completed on five market locations: walkability to farmers’ markets and accessibility to farmers’ markets using the bus system in Chattanooga, TN. Five market locations of two farmer's markets in Chattanooga, TN were chosen because interviews could only be obtained from these markets. In the first analysis, a quarter mile buffer, representing the distance people are willing to walk to a destination, was placed around each of the five farmers’ markets outlined in this study. A quarter mile was chosen based on the transportation and planning literature which cites a quarter mile as the standard walking distance (humantransit.org). Then we completed an intersection between the buffer and the census block groups containing the number of SNAP households per block group. From this information the percentage of SNAP households within walking distance to the five farmers’ markets was determined. Census blocks were used because this was the smallest geographic area available.
Accessibility to farmers’ markets using public transportation was calculated in a similar manner to walkability. First, all the bus routes and their accompanying bus stops that were within a quarter mile of the farmers’ markets were demarcated. Then, a quarter mile buffer was placed around all the bus stops leading to the farmers’ market. An intersect between the buffers around bus stops and the census blocks determined the census block groups that fell within walking distance of the bus stops. This helped identify the percentage of SNAP households that were able to access the farmers’ market using public transportation. The percentage of bus stops providing access to each farmer’s market was also calculated. This was completed for three of the five farmers’ markets because two markets were not within a quarter mile of a bus stop.
There are ten total farmers' markets in Chattanooga, TN. Out of the ten, interviews for two of the organizers were obtained. Interviews were conducted with Lisa Revenig of the Brainerd Farmer's Market and Lori Carter of the Lookout Farmer's Market. The interview with Lisa Revenig was conducted in-person for approximately one hour and the interview with Lori Carter was conducted over the phone for approximately half an hour. The goal of the interviews was to determine if the markets make a conscious effort to make its products available to SNAP participants and to determine how the markets try to make themselves accessible to the public. A total of eight questions were asked of each organizer and were as follows:
- What is the mission or goal of your farmer’s market?
- Does your market have multiple locations and if so, what value do those locations hold?
- How do you advertise your market? Buses, local paper, online?
- How do you define ‘local?’
- What public transportation a consideration when the market was created?
- Who is your target customer at the market?
- Does your market promote access for SNAP participants?
- What problems has your market historically faced and what problems does it currently face?
The in-person interview also allowed us to view where the farmer's market took place and is shown in figure 1. While other farmers' markets locations were accessible, most were other parking lots similar to the Brainerd Farmer's Market and thus were used for parking purposes during the time we had access to them.
Figure 1. Location of the Brainerd Farmer's Market.
Results
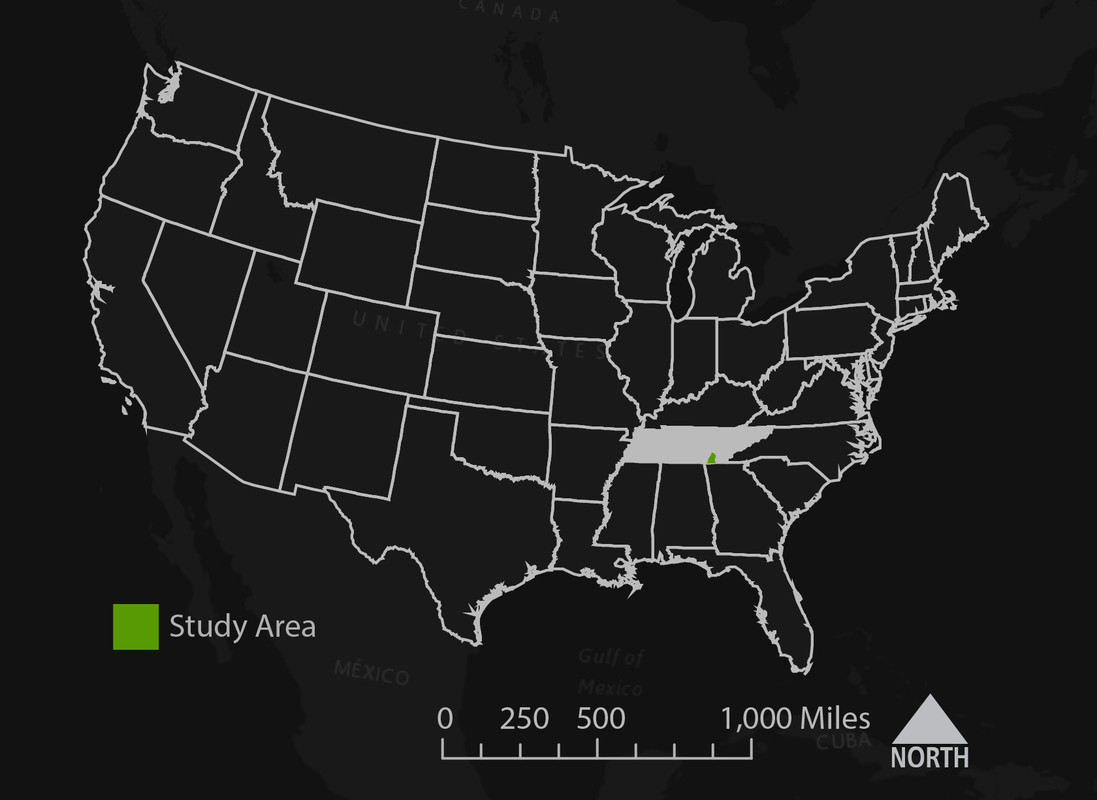
Figure 2. Location of Chattanooga, Tennessee within the contiguous United States. The City of Chattanooga, TN was the study area for the farmers' market analysis.
3
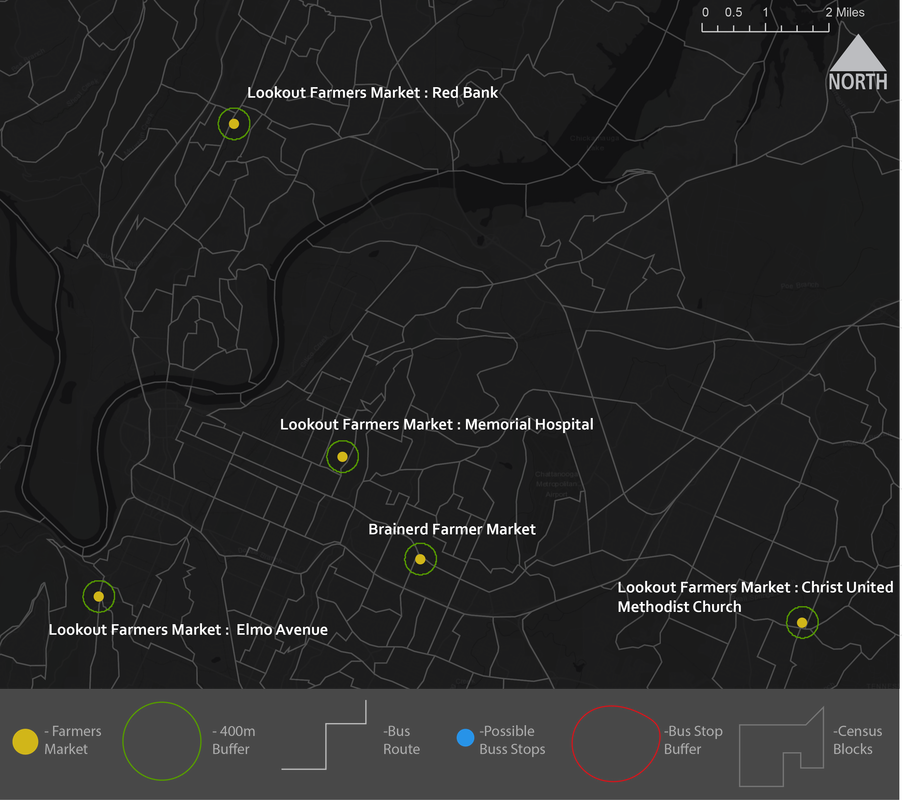
Figure 3. Quarter mile buffer around each farmers' market to denote which census blocks are within walking distance to each farmers' market.
Out of all the SNAP households in Hamilton County, only 1,594, or 8.08% had walking access to the fiver farmers' markets in this study.
Figure 3. Quarter mile buffer around each farmers' market to denote which census blocks are within walking distance to each farmers' market.
Out of all the SNAP households in Hamilton County, only 1,594, or 8.08% had walking access to the fiver farmers' markets in this study.
f
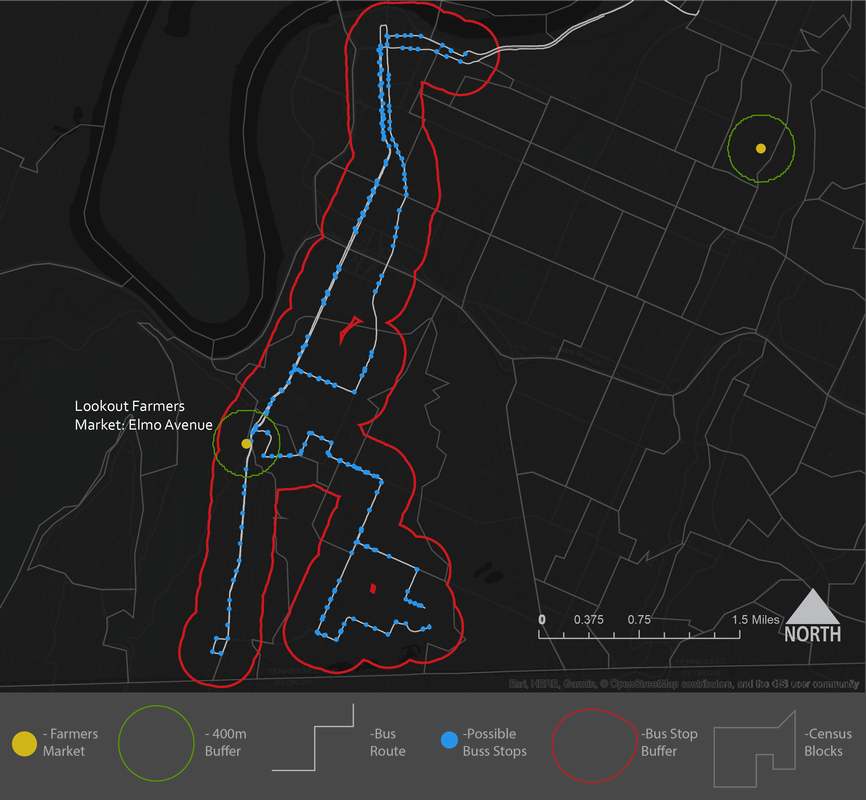
Figure 4. Census blocks within walking distance to bus stops that have access to the Lookout Farmer's Market on Elmo Avenue.
The Lookout Farmer’s Market on Elmo Avenue was accessible to 2,397 or 12.15% of SNAP households in Hamilton County and had 40.10% of total bus stops in Chattanooga providing access to the farmer’s market. Of the three farmers’ markets with bus access, Lookout Farmer’s Market on Elmo Avenue had the most bus accessibility.
5
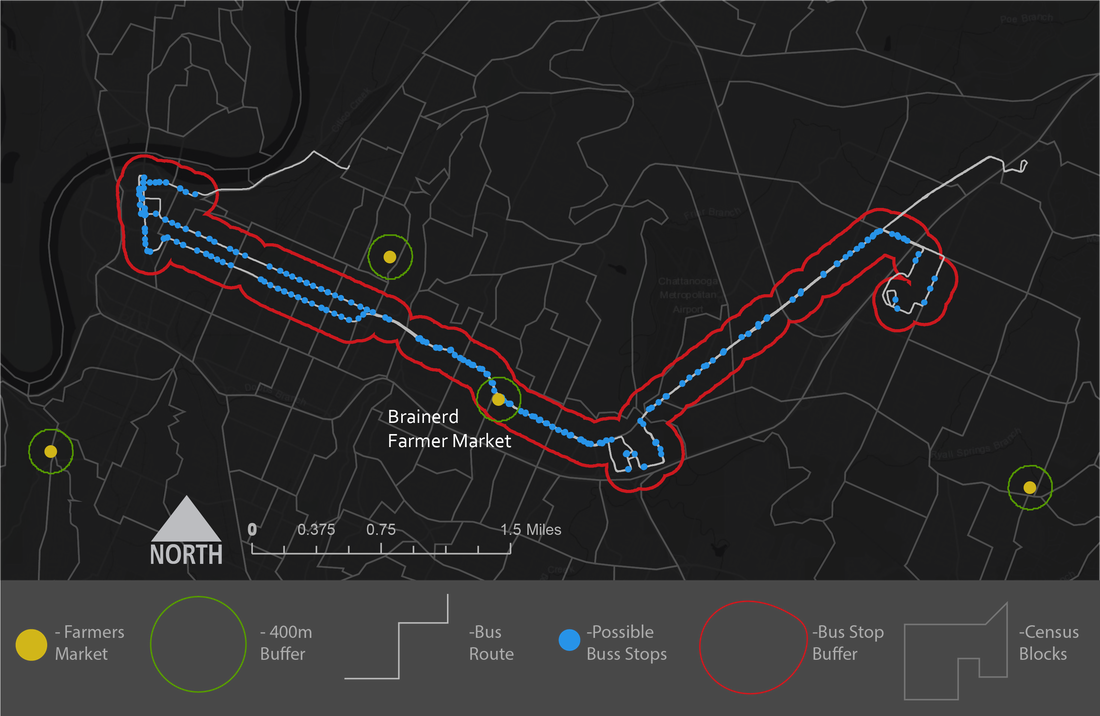
Figure 5. Census blocks within walking distance to bus stops that have access to the Brainerd Farmer's Market.
Brainerd Farmer’s Market was accessible to 4,420 or 22.41% of SNAP households in Hamilton County and was reachable by 39.07% of total bus routes in Chattanooga. The accessibility by bus of Brainerd Farmer’s Market was a close second to Lookout Farmer’s Market on Elmo Avenue and both were in downtown areas which increased the number of accessible bus stops.
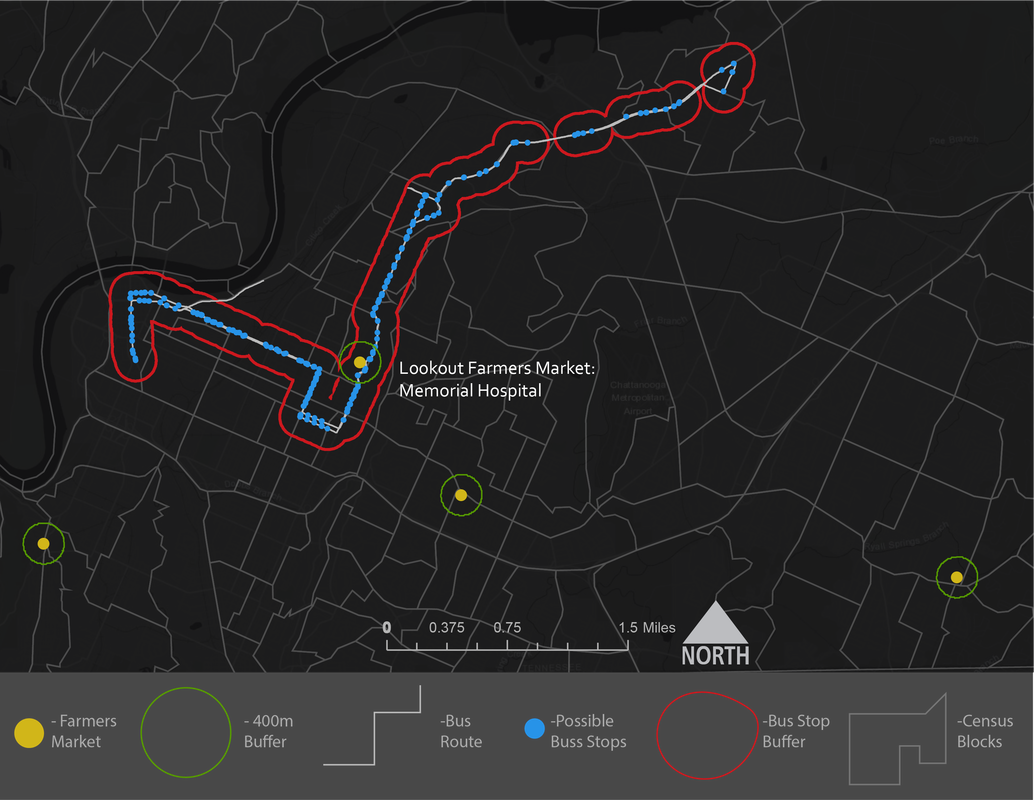
Figure 5. Census blocks within walking distance to bus stops that have access to the Lookout Farmer's Market at Memorial Hospital.
Lookout Farmer’s Market Memorial Hospital was accessible to 5,261 or 26.67% of SNAP households in Hamilton County and was reachable by 31.15% of total bus routes in Chattanooga. The accessibility by bus of Lookout Farmer's Market Memorial Hospital was the lowest out of three farmers markets that had bus access. However, Memorial Hospital had the highest percentage of SNAP households with access to the market.
Overall, we found that The Lookout Farmer’s Market on Elmo Avenue was farther from downtown and had the least amount of access to SNAP households by public transportation. Lookout farmers’ markets Red Bank and Christ United Methodist Church were farther from downtown Chattanooga and had no public transportation access.
The interviews revealed similarities between the two markets. Both markets stated they focused on SNAP participants and tried to make the market more accessible to that particular group. One way the markets reached out to SNAP participants was through advertisements in a variety of locations such as the local newspaper, facebook, a newsletter, or buses. Both markets also mentioned that public transportation was a focus when determining where to hold the farmers’ markets. The Brainerd Market is run by the local church so the location had less flexibility than Lookout Farmer’s Market. However, Brainerd Market has a bus stop just across the street from the church which makes it easily accessible to public transport users. The Lookout Farmer’s Market has four different locations spread throughout the city. Carter stated that public transportation was a factor in each of the locations that were selected for the market (Carter 2018).
In terms of mission statements or goals, the two markets had some similarities and differences. The two markets were committed to making their products more affordable to SNAP participants. However, Brainerd Farmer’s Market took pride in being a market that can help new producers and artisans. Revenig noted that several groups had started at their market due to their low prices to hold a booth (Revenig 2018). One group that started at Brainerd Market now owns their own bakery in downtown Chattanooga. The smaller scale of Brainerd Market has also been problematic because some producers will not sell at the market due to its small size. The Lookout Farmer’s Market had a broader range of interests. Besides providing fresh fruits and vegetables to the local community, particularly families, the market also is a place for artisans to sell their crafts and for local artists to perform. According to Carter, “the market strives to be a place where farmers and consumers can meet, where parents and their children can learn where their food comes from, and where the local community can see local musical talents” (Carter 2018).
Brainerd and Lookout Market both spoke about the costs of the market. As mentioned earlier, Brainerd Farmer’s Market strives to keep their prices down, $25.00 per season and $5.00 per market session they attend. Lookout Farmer’s Market had an application fee of $30.00 and either a $10.00 per session in the outdoor season or $20.00 per session in the indoor season.
Discussion
During the interviews conducted with farmers’ market organizers, each market indicated that one of their primary focuses was promoting the usage of SNAP dollars at their market. When speaking with Lisa Revenig of the Brainerd Market, she detailed that their market began doubling the SNAP dollars used by customers to incentivize the purchase of fresh produce (Revenig 2018). When this program became popular and financially unsustainable for the church, the market paired with AARP and their grant program to continue the promotion of this program, increasing the ability of residents to utilize SNAP dollars for fresh produce. Revenig revealed that most of the advertisement done for the market centers on highlighting the doubling of SNAP dollars as a vehicle for increasing healthy food consumption in Chattanooga. Brainerd Market had a high percentage of bus routes that permitted access to the market, so their advertising has the potential to be quite effective. The fact that the market was advertised on the buses used in Chattanooga’s public transit system increases the potential even more so.
In our discussions with Lori Carter, she also mentioned that SNAP participants were a primary focus of the market in addition to families in the area (Carter 2018). The Lookout Market had a broader range of interests besides just providing fresh produce to SNAP households. In the long-term, the additional attractions such as artisans and local music could attract a consistent number of visitors each week which could solidify their presence in the area and provide a semi-regular source of fresh food in the area. This could then be beneficial to SNAP participants who depend on the markets for fresh food.
The Brainerd Market and Lookout Farmers’ Markets had different emphases that appealed to different residents. In general, the Brainerd Farmer’s Market’s smaller scale, affordability, and advertising specifically to SNAP participants makes it a better market for small-scale producers and SNAP participants. The Lookout Farmer’s Market’s diversity of vendor goods, higher vendor prices, and other attractions appeals to a more affluent community within the city. This is not to say that SNAP participants are not less welcome. However, the higher vendor prices could in turn increase the prices of the produce which means SNAP users are getting less produce for their dollar.
In terms of accessibility, the doubling of SNAP dollars may be effective in practice but the lack of bus route access to the Red Bank and Christ United Methodist Church locations of the Lookout Farmer’s Market diminishes the effectiveness of the double SNAP dollars program. Therefore, the inclusion of SNAP programs at these markets makes the produce more accessible in terms of cost but mobility remains a difficulty for some residents of Chattanooga.
There were several geospatial limitations of the study. For one, SNAP household data was only available at the census block group which led to generalizations in the number of SNAP households within a quarter of a mile of both farmers’ markets and bus stops. Only five farmers’ markets were evaluated in this study due to limited time and interview data. This prevented the formulation of more general conclusions for the Chattanooga farmers’ markets. Of the five markets, only three had public transport access which again is a limiting number of samples. When determining bus stops, only bus stops on routes that directly connected to the farmers’ market were included. Calculations including bus transfers and the time-cost tradeoff were not considered in this analysis. The quarter mile buffer is a hard boundary determined for analysis purposes, but areas within the circular buffer are not all walkable in a quarter mile. In addition, a quarter mile is not the absolute cut-off of the distance people are willing to walk to go to farmers’ markets. These assumptions were used based on previous literature and to simplify analyses.
The interview process also had some limitations. One, we only had one day to conduct interviews. This meant that all possible interviews had to be conducted within that one-day span. Out of the ten farmers’ markets in Chattanooga, only two responded to our interview request. Within that one-day period, only one organizer was available for an interview. This meant that our sample size for our interviews was much smaller than desired. With a larger sample size, a spatial analysis on other markets could have been accomplished. In addition, more interview responses could have helped determine if all markets in Chattanooga have a focus on SNAP participants or if it was solely the Brainerd Market and the Lookout Market.
Overall, the interviews revealed that both Brainerd Farmer’s Market and Lookout Farmer’s Market have a focus on SNAP participants. The spatial analysis confirmed that both markets are accessible to SNAP participants via public transportation. However, two of the four Lookout Farmer’s Market locations were not within walking distance to public transport and thus were only accessible to SNAP participants within the surrounding census blocks based on this study’s limiting considerations. Therefore, this study shows that the desire of both Brainerd Farmer’s Market and Lookout Farmer’s Market to make fresh produce available to SNAP participants is possible because of the accessibility via public transportation.
References
Carter, Lori. 2018. Interview by Lindsey Kurtz, Zach Fischer, and Colin Pitman. Chattanooga. March 20.
Chattanooga Fun. 2018. “Chattanooga Shopping: Local.” Chattanooga: In a State of Joy. Accessed February 9, 2018. https://www.chattanoogafun.com/things-to-do/shopping/?sort=recommended&subcatids=649.
Dimitri, Carolyn, Lydia Oberholtzer, and Michel Nischan. 2013. “Reducing the Geographic and Financial Barriers to Food Access: Perceived Benefits of Farmers’ Markets and Monetary Incentives.” Journal of Hunger and Environmental Nutrition 8: 429-444. Accessed April 16, 2018. http://dx.doi.org/10.1080/19320248.2013.840547.
Elliott, Samantha K, irina Khmelko, and Richard Beeland. 2015. “Food Insecurity Challenge to Families in the Greater Chattanooga Area: The Case of the Food Bank.” Journal of Adolescent and Family Health 7, no. 1: 1-16. Accessed April 28, 2018. https://scholar.utc.edu/cgi/viewcontent.cgi?article=1032&context=jafh.
Hunger in America. 2018. “Hunger in Tennessee.” Feeding America. Accessed April 28, 2018. http://www.feedingamerica.org/hunger-in-america/tennessee/.
Johnson, Steve. 2015. “Getting the fat out of ‘food deserts’ will take time.” Times Free Press. Accessed April 28, 2018. http://www.timesfreepress.com/news/local/story/2015/oct/02/getting-fout-food-deserts-will-take-time/328310/.
LeClair, Mark S. and Anna-Maria Aksan. 2014. “Redefining the Food Desert: Combining GIS with Direct Observation to Measure Food Access.” Agricultural Human Values, 31: 537-547. Accessed April 16, 2018. http://dx.doi.org/10.1007/s10460-014-9501-y.
Lowery, Bryce, David Sloane, Denise Payán, Jacqueline Illum, and Lavonna Lewis. 2016. “Do Farmers’ Markets Increase Access to Healthy Foods for All Communities?” Journal of the American Planning Association 82, no. 3: 252-266. Accessed April 16, 2018. http://dx.doi.org/10.1080/01944363.2016.1181000.
Moreland, Tim. 2016. “CARTA Routes.” Chattanooga Public Library. Last modified August 26. Accessed April 20, 2018. https://data.chattlibrary.org/Transportation/CARTA-Routes/8vmy-jxwa.
Moreland, Tim. 2016. “CARTA Stops.” Chattanooga Public Library. Last modified August 26. Accessed April 20, 2018. https://data.chattlibrary.org/Transportation/CARTA-Stops/ebrc-i5v8.
Regional Planning Agency. 2016. “Renewing our Vision: Comprehensive Plan Update 2030 Phase 1 of Growing Forward.” Chattanooga-Hamilton County. Accessed April 28, 2018. https://chcrpa.org/index.php/planning-projects/comprehensive-plan/.
Revenig, Lisa. 2018. Interviewed by Lindsey Kurtz, Zach Fischer, and Collin Putman. Chattanooga. March 20.
United Sates Census Bureau. 2016. “Receipt of Food Stamps/SNAP in the Past 12 Months by Disability Status for Households.” American FactFinder. Accessed April 20, 2018. https://factfinder.census.gov/faces/tableservices/jsf/pages/productview.xhtml?pid=ACS_16_5YR_B22010&prodType=table.
United States Census Bureau. 2010. “Block Group within Census Tract: All Block Groups within Hamilton County, Tennessee.” American FactFinder. Accessed April 20, 2018. https://factfinder.census.gov/faces/nav/jsf/pages/searchresults.xhtml?refresh=t.
Urban League of Greater Chattanooga. 2012. “Healthy Food Access in the Greater Chattanooga Area.” Accessed April 28, 2018. https://www.pdffiller.com/40500189-urban-league-of-greater-chattanooga-healthy-food-access-paper-full-versionpdf-Healthy-food-access-in-the-Chattanooga-area-Urban-League-of-ulchatt-Various-Fillable-Forms-ulchatt.
Walker, Jarrett. 2011. "Basics: Walking Distance to Transit." Human Transit: The Professional Blog of Public Transit Consultant Jarrett Walker, April 24. Accessed April 16, 2018. http://humantransit.org/2011/04/basics-walking-distance-to-transit.html
Special Thanks to Lisa Revenig for sitting down with us to discuss the Brainerd Farmer's Market.
